
Hello, and welcome to the Week 3 XFP Report. If you’re unfamiliar with XFP, I’ll get to that in a little bit.
But basically, every week we’re going to be telling you which players are seeing the best volume for fantasy, as measured by Expected Fantasy Points (XFP). We’ll be telling you who the best buy-low and sell-high candidates are, as measured by Points Above Replacement (PAR), or the differential between actual- and expected fantasy points. This is an especially effective approach in DFS, where players are typically priced by production rather than volume, though PAR will regress to the mean. And (at the end of the article) we’re going to be telling you who the best volume-per-dollar DFS plays are.
What is XFP?
Premium subscribers can access XFP (and other advanced stats like air yards, deep targets, end zone targets) here.
Expected fantasy points (XFP) is flat-out the best and most comprehensive way of measuring a player’s volume. It’s telling you – based on a player’s unique usage – how many fantasy points that player should have scored. It’s telling you how many fantasy points a perfectly league-average RB, WR, or TE would have scored with that same exact volume. It looks at every individual carry by down and distance and distance from the end zone and every individual target by depth of target and distance from the end zone, and then cross-references each carry and target to each carry and target with those specific qualifiers over a multi-year sample to tell you what exactly those carries and targets are worth (historically).
Expected touchdowns (XTD), same thing. RBs score from the one-yard line on 54% of their attempts. RBs score from the 17-yard line only 3.6% of the time. So why ever use “red zone carries,” which treats both carries the same, as a fantasy stat? I have no idea.
Why doesn’t everyone point to XFP in their fantasy research? I have no idea. Once you have XFP and XTD you can contrast that with a player’s actual fantasy points or actual touchdown total to tell you how efficient a player has been (PAR). This is especially useful in highlighting regression candidates, buy-low targets, and mispriced players for DFS.
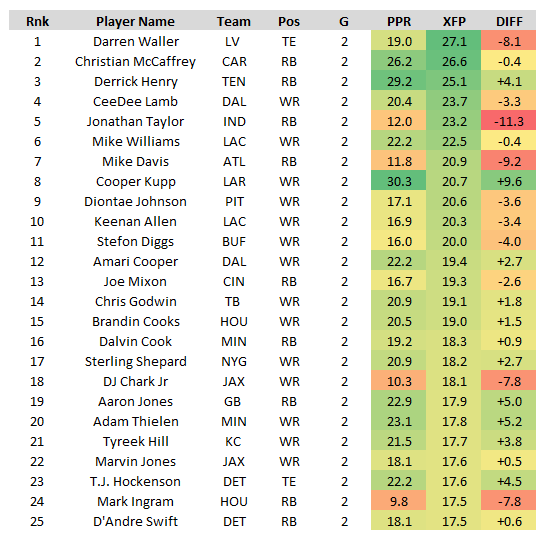
Through 2 weeks of action, here are the top-25 players in expected fantasy points (XFP) per game:
The Top 25
Top Regression Candidates
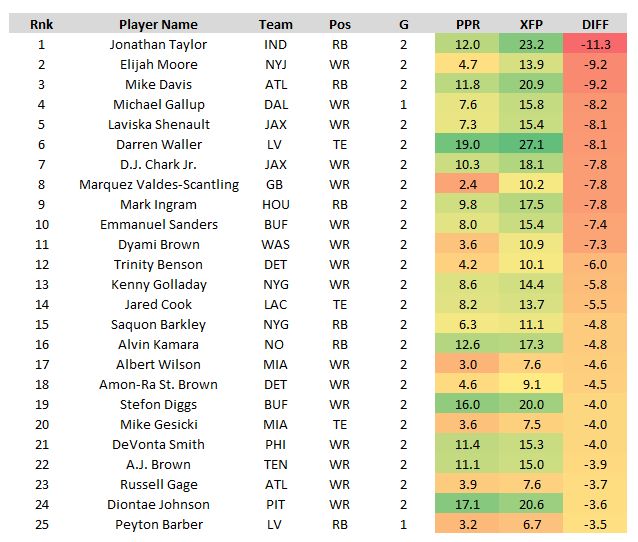
Jonathan Taylor, RB, Indianapolis Colts
[FPG: 12.0, XFP: 23.2, Diff: -11.3]
Taylor is your No. 1 positive regression candidate as we head into Week 3, averaging just 12.0 FPG on a 23.2-point expectation (3rd-best).
Taylor ranked 9th in FPG (16.9) last year but just 19th in XFP per game (13.4), scoring +3.5 FPG over his expectation (4th-best). By XFP, he offered a high floor, with a season-low of 9.1 XFP, but didn’t offer much of a ceiling. His season-high in XFP came in Week 17, when he scored 38.4 fantasy points, but on an expectation of just 20.9. For perspective, across the full season there were 91 instances of a running back eclipsing that mark in a single week.
The good news is: Taylor’s volume is a lot better than it was last year. He’s already eclipsed last year’s season-high in both Week 1 (25.2) and Week 2 (21.2). Which is to say, if he was as hyper-efficient as he was last year, with this sort of volume, we should expect him to average 26.7 FPG.
The bad news is: He ranks just 25th in FPG (12.0).
But, more good news: that’s bound to change. Touchdown efficiency is far more a function of luck than skill. And that’s the main catalyst behind his lack of success this season. Taylor has seen 7 opportunities inside the 5-yard-line (most, +2) and 9 opportunities inside the 10-yard-line (most, +2). He’s found the end zone only once thus far, but should have scored (per XTD), 3.9 times (most by +1.2). Remember, Taylor is a freak athlete (5-10, 226 lbs, 97.7 SPORQ), a generational prospect, and an all-time great touchdown-scorer, averaging 16.8 touchdowns per season dating back to his freshman year at Wisconsin.
More good news: He’s more involved in the passing game, averaging 6.4 receiving XFP per game, up from 3.9 last year. That should help make him less week-to-week volatile and less gamescript dependent.
But more bad news: He’s still far from a bell cow, ranking just 29th in Snap% (50%). Marlon Mack inexplicably played on 19% of the team’s snaps last week.
And, the worst news yet: Carson Wentz is dealing with two(!) ankle sprains. That hurts the offense as a whole, and especially Taylor. For his career, Taylor averages 17.6 FPG in victories but only 13.8 FPG in losses. This was a big reason why I was lower than Taylor than the rest of the community heading into the season (RB12 by my rankings, RB6 by ADP); Dr. David Chao (@ProFootballDoc) had initially set the over/under on Carson Wentz's return at Week 6. If Indianapolis goes 0-5 to start the year, and their next three games are very tough (@TEN, @MIA, @BAL), we might not see Wentz again all year. Remember, the Colts gave up a second-round pick which could turn into a first-round pick if Wentz plays on at least 75% of the team's snaps this year, so it seems they're heavily incentivized to sit him.
For this reason, he might be a sell-high. Taylor is an amazing talent and his volume (despite being capped at 50% of the team’s snaps) has been excellent. But we have to worry about a potential Wentz-benching long-term. And in the short term, Wentz’s status is up in the air. And Indianapolis also has three starting offensive linemen banged up: LG Quenton Nelson (foot/back), RT Braden Smith (foot), and LT Eric Fisher (Achilles) are still on the injury report and listed as questionable.
Elijah Moore, WR, New York Jets
[FPG: 4.7, XFP: 13.9, Diff: -9.2]
My guy all offseason, Elijah Moore, the farmer’s son, ranks as your No. 2 positive regression candidate.
Including plays negated due to penalty, Moore is averaging (per game): 7.0 targets, 115.5 air yards, 2.5 deep targets, 13.9 XFP, and 4.7 FPG. That’s decent, mid-range WR4-levels of volume, but personally embarrassing levels of production.
I’m still very bullish on Moore long-term. And even in the short-term, he should still be rostered in all formats. But I am, truthfully, a little less optimistic now than I was in the offseason.
The Jets were projected to have a bottom-12 offensive line, but they actually have (probably) the worst offensive line in football. Wilson has been under pressure on 50% of his dropbacks (worst), and their starting LT Mekhi Becton is out until late-October.
I really hope I’m not wrong on Moore. I really hope I wasn’t a year too early (like it seems I might have been on Marquise Brown). But, I think the next three weeks will be a good litmus test. The Jets get Denver, Tennessee, and Atlanta over their next three games, who rank, respectively, 27th (Bradley Chubb is out for Week 3), 31st, and 32nd in PFF Pass Rush Grade.
Mike Davis, RB, Atlanta Falcons
[FPG: 11.8, XFP: 20.9, Diff: -9.2]
Davis is your No. 3 positive regression candidate.
Through two weeks, Davis is averaging (per game): 13.0 carries (19th), 8.0 targets (4th), and 20.9 XFP (4th) on a 68% Snap% (13th). He leads all RBs in receiving XFP.
On one hand, the volume he’s seeing is excellent. On the other, his inefficiency is especially alarming in light of Cordarelle Patterson’s hyper-efficiency. Patterson is averaging 16.3 FPG on a 12.1-point expectation, giving him a +4.2-point differential (3rd-best).
So, we can argue this two different ways:
1) Patterson is significantly more efficient than Davis. It’s only a matter of time until Patterson takes over this backfield. Or, at the very least, tips this committee more towards his favor.
2) Davis is an ideal high-risk / high-reward buy-low trade target, coming off of a game against the league’s best run defense. Patterson has been the more efficient running back, but not necessarily the better one; Davis ranks 22nd in PFF Grade, Patterson ranks 25th. Every year there’s a number of Duke Johnson-esque RBs the fantasy community wants to see get 15-plus touches per game. But, for whatever reason, and through multiple coaching staffs, they’re always inexplicably capped at 6-12 touches per game. Perhaps the 30-year-old former-WR Patterson fits that bill.
On Twitter, due to a limited character count and a penchant for malevolence, this has translated to:
1) “Mike Davis was a wasted pick, he was always going to be a wasted pick. Your an idiot for drafting him.” [bad grammar for emphasis]
2) “Chase volume. He’s seeing RB1-volume. The production will follow.”
Ultimately, I find both points very compelling. I don’t have any exposure to Davis in season-long leagues, but could see myself trying to buy-low (very low) for my RB-needy teams.
Darren Waller, TE, Las Vegas Raiders
[FPG: 19.0, XFP: 27.1, Diff: -8.1]
Waller leads all players at all positions in XFP, and is also your No. 6 positive regression candidate.
He also leads all players at all positions in targets (29), by 4, and ranks 3rd in air yards (304). Since Week 13 of last season, he leads all players at all positions in targets, receiving yards (by 105), and total fantasy points scored. He averages 24.3 FPG over this span, which ranks behind Travis Kelce (25.1), but ahead of all WRs.
Yeah, Waller is an absolute freak cheat code. So is Kelce.
How freakish? How much of a cheat code? Based on VORP (ESPN standard settings), owning a TE averaging 25.1 or 24.3 FPG, is equivalent to owning a WR averaging 28.5 or 29.3 FPG (respectively). Though the all-time record for a WR is just 26.5, set by Elroy Hirsch in 1951.
D.J. Chark Jr., WR, Jacksonville Jaguars
[FPG: 10.3, XFP: 18.1, Diff: -7.8]
D.J. Chark is your No. 7 positive regression candidate.
Among WRs, he ranks 22nd in targets per game (9.0), 2nd in air yards per game (162.5), 11th in XFP per game (18.1), but just 56th in FPG (10.3).
Per Graham Barfield, “Just 38% of Chark’s targets have been catchable – which is dead last by a mile among all WRs with 10 or more targets.” That's partly a function of Trevor Lawrence's play, and partly a function of his high aDOT (16.5, 10th-highest).
Believe it or not, despite the slow start, I like Chark a lot more now than I did in the offseason. I do expect him to remain inefficient throughout the first month or so of the season, and he’s going to be highly volatile week-to-week, like he’s always been, but I’d bet he more than justifies his ADP by season’s end.
Chark hasn’t been too efficient, but I think that’s understandable. QB rapport isn’t something that develops overnight, and Chark was at a massive disadvantage, relative to the other receivers on the team, in this regard. He missed all of the team’s preseason games and months of practice time. So, his volume is highly encouraging, and I suspect his efficiency and rapport with Lawrence will continue to improve as the season goes on.
But, again, even when he’s hitting and QB rapport is improved, Chark is going to remain highly volatile week-to-week.
From the XFP Report last year:
“From a fantasy perspective, this is sort of who Chark is and who he’s going to be all year. He’s a phenomenal talent, and he’s seeing – although not a high number of targets – high-quality targets. But those high-quality targets are naturally going to make him more volatile and boom-or-bust week-to-week. To me, commonly used metrics like air yards and deep targets are best used to describe what type of player a specific WR is, rather than how valuable their role is -- XFP, which incorporates air yards, is the superior metric in that regard. Air yards are telling me how safe or volatile a player is, how high or low their ceiling and floor is for fantasy. High air yardage totals (or deep targets per game) relative to XFP would tell me that a specific player is going to be boom-or-bust for fantasy, and likely better suited for DFS tournaments. The reverse would tell me a player offers a high-floor, and might be suited for DFS cash games.”
Chark has seen five deep targets totaling 151 air yards, worth a combined 14.9 XFP. On average (this season), deep targets have only been catchable (per PFF) about 50% of the time, and deep targets have only been caught (factoring in drops) 42% of the time. If all five of those deep targets were caught, they’d be worth somewhere between 20.1 fantasy points at a minimum and 68.5 fantasy points at a maximum (334 total yards from the end zone).
There are going to be weeks he catches zero, tanking your GPP lineups. And there are going to be weeks he catches three, giving you a week-winning score.
So, basically, just note that WRs like Chark (and also, thus far, Elijah Moore and Marquez Valdes-Scantling) are always going to be highly-volatile fantasy assets, but always in play for DFS tournaments as potential slate-busters. You just need a few coin-flips to go your way. And when looking at our data, know that XFP will be best at providing a player’s median and mean expectation, but using that in conjunction with air yards and/or deep targets per game can better represent a player’s floor vs. ceiling expectation – the more air yards or deep targets, the more volatile this player is going to be week-to-week.
Emmanuel Sanders, WR, Buffalo Bills
[FPG: 8.0, XFP: 15.4, Diff: -7.4]
Emmanuel Sanders is your No. 10 positive regression candidate.
And he’s either a phenomenal DFS-play this week, priced as just the 58th most-expensive WR on DraftKings ($4,200). Or, in his age 34 season, he’s just the new 2020 A.J. Green.
Among WRs, Sanders ranks 24th in targets per game (8.5), 6th in air yards per game (136.5), 14th in end zone targets per game (1.0), 24th in XFP per game (15.4), but just 74th in actual FPG (8.0).
He’s clearly the team’s WR3, running a route on 91% of the team’s dropbacks (versus Gabriel Davis’ 49%). But if he remains as inefficient as he’s been, that won’t last very long.
Other Notable Names
Brandin Cooks, WR, Houston Texans
[FPG: 19.0, XFP: 20.5, Diff: +1.5]
Among all WRs, Cooks ranks (per game): 7th in targets (11.0), 1st in air yards (165.5), 9th in XFP (19.0), and 12th in FPG (20.5).
Cooks now averages 29.1 DK FPG over his last four games, hitting at least 21.0 in all four.
Yeah, so, just keep starting him. Davis Mills at QB probably isn’t ideal, but, at the same time, Mills targeted Cooks on 9 of his 18 throws last week (50%). The Texans really have no choice but to keep force-feeding Cooks the ball.
Marvin Jones, WR, Jacksonville Jaguars
[FPG: 18.1, XFP: 17.6, Diff: +0.9]
While Chark is seeing good volume, but not quite producing like it. Jones is seeing high-end WR2 volume and also producing like a high-end WR2.
Jones is just the 40th most-expensive WR on DraftKings this week ($4,900), though he averages 18.0 FPG over his 12 games.
And this season, he ranks (per game): 17th in targets (9.5), 9th in air yards (132.0), 4th in end zone targets (1.5), 5th in deep targets (2.5), 15th in XFP (17.6), and 16th in FPG (18.1).
Jones and Chark both get an easy top-5 matchup this week. Mike Clay had Arizona’s cornerback unit ranked 3rd-worst heading into this season, and this game offers the 4th-highest over/under of the week (52.0). With Laviska Shenault banged up and questionable, he’s a top value and a top play this week.
Diontae Johnson, WR, Pittsburgh Steelers
[FPG: 17.1, XFP: 20.6, Diff: -3.6]
Johnson only does three things: earn double-digit targets, get hurt, and chew bubblegum. And, folks, he’s all out of bubblegum.
>Diontae Johnson - Total Targets
— Scott Barrett (@ScottBarrettDFB) September 20, 2021
+ Last 17 games w/ Big Ben
W1- 10
W2- 13
W3- injury
W5- injury
W7- 15
W8- injury
W9- 10
W10- 11
W11- 16
W12- 13
W13- 12
W14- benched for drops
W15- 13
W16- 14
W18- 16
W1- 10 (also injury)
W2- 12 (also injury)
AVG: 12.7
10+ targets in 13 of 13
Cooper Kupp, WR, Los Angeles Rams
[FPG: 30.3, XFP: 20.7, Diff: +9.6]
Rams Receivers by Total Routes: Cooper Kupp (60), Van Jefferson (56), Tyler Higbee (51), Robert Woods (50)
Rams Receivers by Total Targets: Cooper Kupp (21), Robert Woods (12), Tyler Higbee (7), Van Jefferson (6)
Cooper Kuppatron? It seems QB Matthew Stafford only has eyes for Kupp, just like he only had eyes for Calvin Johnson in 2012, when he out-targeted the next closest Lions receiver by 102.
Kupp currently leads all non-QBs in FPG (30.3), and that’s probably not at all sustainable (his +9.6-point differential ranks behind only Tyler Lockett), but I don’t see why he can’t finish the season as a top-5 fantasy WR.
But I’d definitely be at least a little nervous if I was a Woods owner. It’s really bizarre to see that both Jefferson and Higbee have been on the field running routes more often than he has. He’s still an every-week starter, but I think he probably fails to live up to his WR13 ADP.
Tyler Higbee, meanwhile, is still probably your No. 1 trade target. He flopped last week (1.8 fantasy points), and only saw 1 target, but otherwise the usage was ideal. Everything I wrote up last week here, remains as true as it was when I wrote it.
Mike Williams, WR, Los Angeles Chargers
[FPG: 22.2, XFP: 22.5, Diff: -0.3]
Chargers OC Joe Lombardi tried to tell us in June that Williams was in line for a massively expanded, potentially Michael Thomas-esque role. And no one wanted to believe him (ADP WR47). But that’s exactly what we’ve seen play out.
Through two weeks, Williams ranks 2nd in targets per game (12.0), 2nd in end zone targets per game (2.0), 2nd in XFP per game (22.5), and 5th in FPG (22.2).
And his 9.9 aDOT is also more in line with Keenan Allen’s typical usage (9.3) than his prior career average (16.2).
Anyway, Lombardi is about to make Williams and his fantasy owners a lot of money this season.
Keenan Allen ranks behind Williams in every major stat, but he still ranks 5th-best in XFP per game (20.3). Given Williams’ expanded role in the offense, we should probably be expecting lower totals for Allen than what he saw last season, but he’s still a great bet to finish as a fantasy WR1.
Quick Hits
For the first time in his career, last week, Tony Pollard saw a more valuable-workload than Ezekiel Elliott (11.9 to 11.1). Pollard also ranks 2nd-best among RBs in fantasy points over expectation (+5.6 per game).
DeVonta Smith ranked behind only Jonathan Taylor as fantasy football’s least efficient player in Week 2. His 17.2-point expectation ranked 17th-best among WRs on the week, though he scored just 3.6 fantasy points. On the season, he ranks 26th in XFP per game (15.3). Jalen Hurts underthrew him for a long TD.
D.J. Moore ranks 16th in XFP per game (17.2), Robby Anderson ranks 75th (7.8), and rookie Terrace Marshall ranks 76th (7.6).
Ja’Marr Chase ranks 20th in FPG (17.2), just behind Rondale Moore (17.7), Zach Pascal (17.6), and K.J. Osborn (17.4) — lolwut — but ranks just 70th in XFP per game (9.1). Tee Higgins ranks 21st (15.7).
Darren Waller led all TEs in XFP in Week 1 (39.5) and ranked 2nd-best in Week 2 (14.7). Waller leads the next-closest TE (T.J. Hockenson), by +9.5 XFP per game. Hockenson ranked 2nd among TEs in Week 1 XFP (19.8), he led all TEs in Week 2 (15.4).
TEs by XFP/G: Darren Waller (27.1), T.J. Hockenson (17.6), Rob Gronkowski (14.2), Jared Cook (13.7), Travis Kelce (12.8), Kyle Pitts (11.3), Jack Doyle (10.4), and Mark Andrews (9.3).
Sterling Shepard ranks 10th among WRs in XFP per game (18.2). He now averages 8.5 targets per game over his last 12 games, and has scored at least 17.5 fantasy points in each of his last four games.
RB Team XFP%
1. Christian McCaffrey (34%)
2. Joe Mixon (31%)
3. Alvin Kamara (31%)
4. Derrick Henry (28%)
5. Jonathan Taylor (28%)
6. Aaron Jones (25%)
7. Mike Davis (25%)
8. Dalvin Cook (23%)
9. Darrell Henderson (23%)
10. Damien Harris (22%)
RB Team Pos XFP% (The Bell Cow Stat)
1. Najee Harris (97%)
2. Joe Mixon (85%)
3. Darrell Henderson (85%)
4. Christian McCaffrey (84%)
5. Dalvin Cook (80%)
6. Chris Carson (80%)
7. Derrick Henry (78%)
8. Clyde Edwards-Helaire (78%)
9. Alvin Kamara (75%)
10. Aaron Jones (75%)
11. Austin Ekeler (71%)
12. Saquon Barkley (70%)
WR / TE Team XFP%
1. Cooper Kupp (30%)
2. Diontae Johnson (29%)
3. Tyler Lockett (27%)
4. TE, Darren Waller (27%)
5. CeeDee Lamb (26%)
6. Tyreek Hill (25%)
7. Tee Higgins (25%)
8. Deebo Samuel (25%)
9. Sterling Shepard (24%)
10. Brandin Cooks (23%)
11. Mike Williams (23%)
12. Chris Godwin (23%)
13. Stefon Diggs (23%)
14. DK Metcalf (23%)
15. Adam Thielen (22%)
DFS Values (DK)
1. Mike Davis, RB (4.1X)
2. Hunter Renfrow, WR (3.7X)
3. Darren Waller, TE (3.7X)
4. Emmanuel Sanders, WR (3.7X)
5. Elijah Moore, WR (3.6X)
6. Marvin Jones Jr., WR (3.6X)
7. Jared Cook, TE (3.5X)
8. Mike Williams, WR (3.5X)
9. Laviska Shenault, WR (3.5X)
10. Jonathan Taylor, RB (3.5X)
11. Quintez Cephus, WR (3.4X)
12. DJ Chark, WR (3.4X)
13. TJ Hockenson, TE (3.4X)
14. Diontae Johnson, WR (3.2X)
15. KJ Osborn, WR (3.2X)


