
In Part 1 of this series, a full-scale dive into the theory and math underlying fantasy football Wins Above Replacement was explored, and the top-60 players of 2020 were graphed in rank order displaying how many estimated wins they provided fantasy managers over a replacement-level at its position. In this edition, we pivot from individual player evaluation to position evaluation in terms of WAR. The goal in doing so is to obtain an objective perspective of which positions matter most to your team’s bottom line: wins.
Below is a distribution of weekly win percentages provided by all starting caliber players at each position through the 16-week 2020 season. As explained in Part 1 of this series, starting fantasy players were those with the top-12 (top-24 for RB/WR) highest ESPN league start percentages per week for each position.
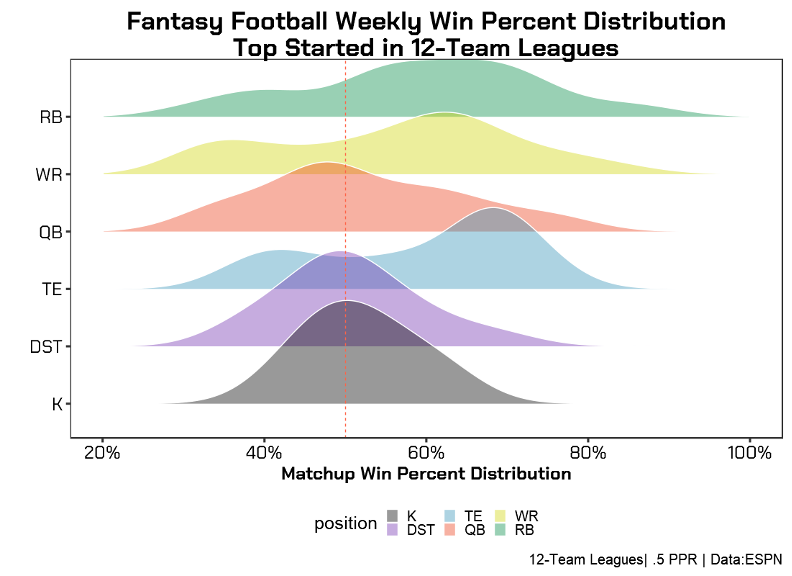
The broad takeaway from this graph is that RB is the position with both the greatest win percentage provided at the top of the distribution and the greatest difference between the best and worst performances of starters. That’s all despite 2020 being considered a down year for RB with top billing like Christian McCaffrey, Saquon Barkley, Joe Mixon, Austin Ekeler, and Miles Sanders missing considerable time. But while the graph above demonstrates that RB is the most valuable position based on who was most likely to start on a week-to-week basis, players are either acquired in fantasy drafts or throughout the season via waivers. Using the ESPN data and ADP data from fantasycalculator.com, we’ll take a look at how well the fantasy market performed through both acquisition avenues with a particular interest in the RB and WR markets.
Positional Success Via Draft
Below is a similar chart as before, but with a couple of important changes. Instead of using the weekly top-started players, only projected starters from 2020 drafts were considered for each position in all 16 weeks (top 24 drafted RB/WR and top-12 for all else). This means that for anyone who missed a game, the replacement-level expected out of that position was substituted as explained in Part 1 of this series. The other change is that WAR is used on the X-axis this time, instead of win percentage.
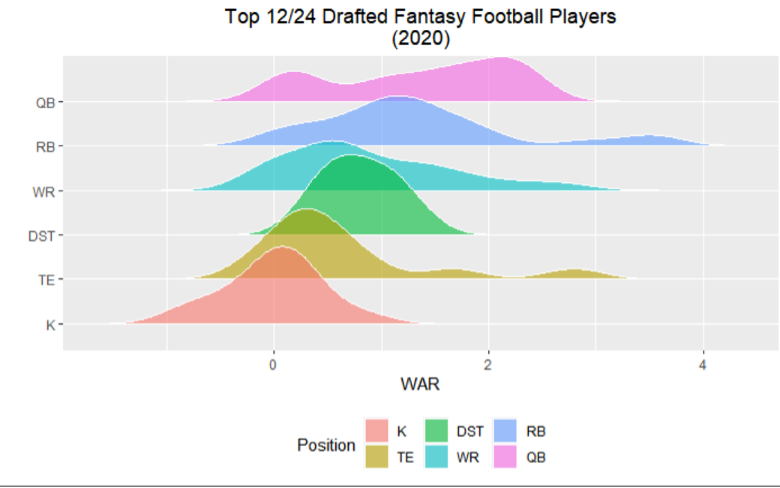
The graph is sorted from top-down in average WAR for each position distribution. Surprisingly, it was league starting QBs who edged out RB as the position with the most WAR value (1.35 vs. 1.33). 2020 certainly threw a wrench in the “Wait on QB” approach, and very well might turn out to be a fluky outlier season … but it might also be a sign of the viability of drafting a top-QB earlier than most analysts believe given the increase of QBs who use their legs as a weapon. Time will only tell.
The drop off from RB to WR WAR is much steeper (1.33 vs .88), flying in the face of Zero-RB enthusiasts. This is easily the biggest takeaway from the positional breakdown — the fantasy community is divided into those who value taking RBs early and often in drafts, and those who wait for late-round flyers and saving big FAAB money for RBs on the Waiver Wire. Well visit the viability of this strategy in the next section.
To wrap up the other positions, the top-12 drafted DSTs and Ks were hardly relevant, given the nature of these positions being highly streamed, but the lack of variance from the top-performing to bottom-performing confirm most analysts’ suggestion that you’re not really getting much more than a replacement-level player by drafting anyone early. TE, on the other hand, has a gigantic separation from the top names (Travis Kelce, Darren Waller) and the bottom barrel chum.
Positional Success Via Waiver Wire
Looking at positional success through the lens of the Waiver Wire, using the massive amounts of data from ESPN leagues, provides a unique way of grading a position’s Waiver Wire effectiveness. I wrote an in-depth article on this withDynasty Nerds that includes the following graph, charting success of players at each position the week they were picked up across percent change in ESPN league ownership. The idea is this: if a position can be counted on coming off the Waiver Wire, those most sought after off the Wire should be more productive. Here’s how that looked for each position.
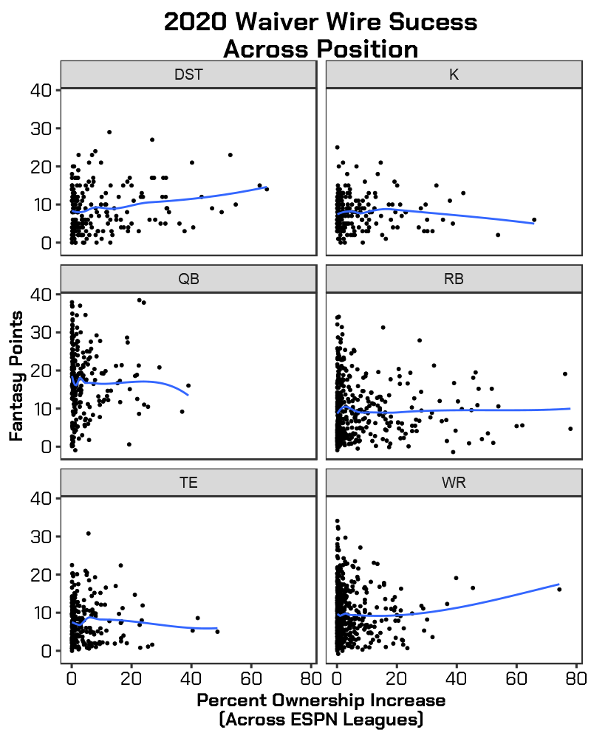
The graph reveals that top-name Waiver Wire pickups were not more reliable than casual dart throw flyers for most positions, with a clear exception to DST and WR. In comical fashion, highly sought Ks provided fewer points on average than Ks with less than 1% ownership increase – all the more reason to confirm that kickers in fantasy are complete chaos.
But the real story here has to do with RB. As teased earlier, Zero-RB analysts typically go after RBs on the Waiver Wire — after all, plenty of “league winners” have come from the Waiver Wire. But how viable is that strategy? The chart here suggests that RBs who are highly sought after (due to a big week or an injured starter) do very little in the first week after fantasy managers lighten their FAAB pockets or top Waiver selection to acquire. Contrast this with the success from WR, a position Bell Cow or Bust managers would be more likely to use waiver claims on.
But again this is still just one week — you can argue a big FAAB bid or a spent top Waiver priority should be looked at as an investment. The last piece of this is to look at the point in which a player was picked up and track success in points not only that first week, but the rest of the fantasy season. This accounts for any Waiver pickups intended for the long haul of a season, vs a potential one-week spot play.

Focusing on the RB/WR dynamic, there is a slight edge to RB success throughout the rest of the season vs WR for all players taken up to around 30%. However, the advantage is not nearly as dramatic as you might think (1-2 fantasy points per week, on average). And after this 30%, the data becomes a bit sparse but confirms a lack of any increase in RB points as a function of roster increase percentage. This could be a result of high-ownership increase RBs being more likely to be used as spot plays (thus being dragged down by poor performances in weeks following) but since we already know little is provided from spot-play RBs from the previous graph, the evidence clearly reveals that the market can’t consistently succeed with Zero-RB.
Takeaways
Considering these positional breakdowns for 2020, focusing on RBs early in drafts remains the best bet even in a down year for the position. The data just doesn’t suggest finding top-tier RB1 consistency post-draft is possible, and while there’s definitely risk in drafting a Round 1 bust, managers still have to take their shot.
Aside from RB, there is also good reason to think of drafting a top-tier TE, as well. That means Travis Kelce. I don’t even hate taking him #1 overall to get someone with just about as much WAR as a top-tier RB without the level of risk tied to RB, though that’s clearly a contrarian strategy.
QB is a little trickier. It’s hard to tell if 2020 was just a fluke year, or if the dynamic of the position has changed. But historically speaking, it’s not often the top QB one year comes anywhere near QB1 the year following. And in the final installment of this series, we’ll visit prior season WAR results and analyze on both the individual and position level. The goal will be to evaluate year-over-year consistency on both the individual level and position level.


